


Students with disabilities and Black students were disproportionately affected by restraint and seclusion practices in U.S. public schools, per a November 9, 2026, report from the District Administration.
The findings come from the U.S. Department of Education’s Office for Civil Rights, which released its latest ‘First Look’ report on September 30, 2026, examining school conditions during the 2023-24 academic year.
The federal survey covered 97,094 schools across 17,591 districts, representing approximately 49.7 million students.
Students With Disabilities Accounted for Most Physical Restraints
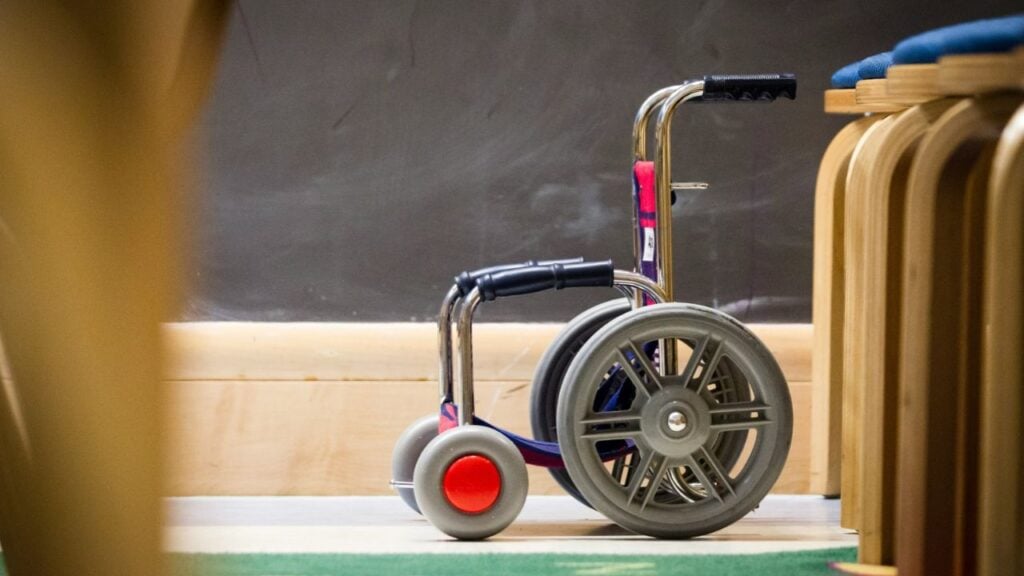
The federal data showed that approximately 129,700 students experienced physical restraint, mechanical restraint or seclusion during the reporting period.
Students receiving services under the Individuals with Disabilities Education Act (IDEA) represented 15 percent of K-12 enrollment but accounted for 73 percent of students physically restrained and 68 percent of those secluded.
The disparity extended beyond disability status. Black students represented 15 percent of enrollment but accounted for 46 percent of students subjected to mechanical restraint.
Boys also accounted for at least three-quarters of students in each restraint and seclusion category.
The Education Department distinguishes between these practices. Physical restraint involves restricting a student’s movement, while mechanical restraint involves equipment used to limit movement. Seclusion means involuntarily confining a student in an area they cannot leave.
School Suspensions Showed Similar Disparities
The report also examined how schools disciplined students during the same academic year.
Approximately 2.3 million students received in-school suspensions, while 2.5 million received out-of-school suspensions. Another 123,100 students were expelled.
Black boys represented just 7 percent of enrollment but accounted for 22 percent of out-of-school suspensions and expulsions.
Black girls, who also represented 7 percent of students, accounted for 14 percent of out-of-school suspensions.
Students receiving Individuals with Disabilities Education Act (IDEA) services accounted for 27 percent of out-of-school suspensions, despite representing a smaller proportion of the student population.
These figures show differences in disciplinary outcomes, although the national data alone do not establish what caused them.
Federal Guidance Addressed Restraint and Seclusion

The findings also highlight existing federal guidance on how schools respond to students with disabilities.
The Education Department’s civil rights guidance identifies restraint and seclusion as practices that may raise disability discrimination concerns.
The agency has previously addressed such cases through agreements requiring schools to revise policies, train employees, and monitor their procedures.
However, the latest figures do not determine whether individual schools violated federal protections.
Parents can review publicly available Civil Rights Data Collection information to examine restraint, seclusion, and disciplinary patterns in their children’s school districts.

